Preliminary Financial Report FY22
One of the City Controller’s primary responsibilities is analyzing and reporting on the City’s financial health. The Preliminary Financial Report, made available each October after the City closes its books, is the first of such report each year. It provides information on how the City spent its money over the past fiscal year, with data and analysis of the City’s revenues and expenditures, reserves and bonded indebtedness.
Although the last fiscal year was solid thanks to an uptick in revenue and federal assistance, numerous economic challenges remain and difficult budgeting decisions could arise next year. Explore the report summary with interactive data visualizations, followed by the full text of the report.
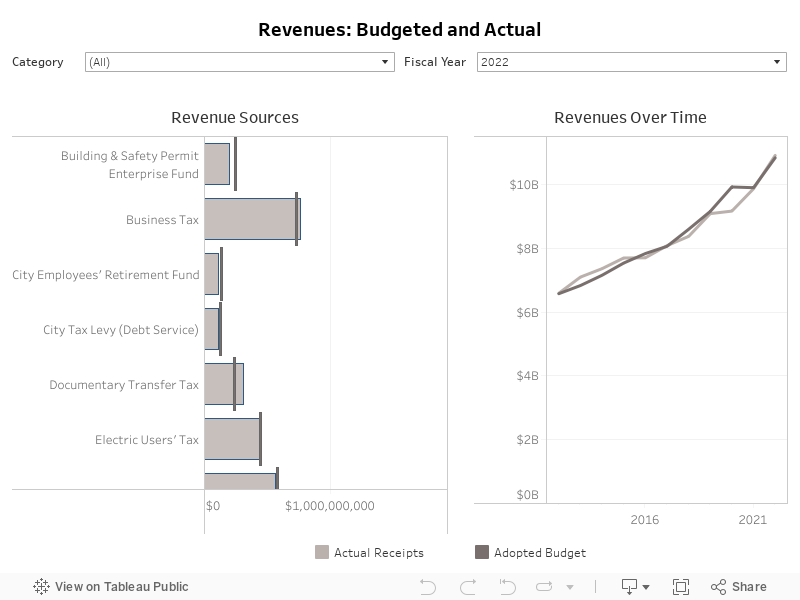
Revenues
During the 2021-22 fiscal year, total revenues in budgeted funds were $10.2 billion last year, a 10.4% increase over the prior year and 12.2% more than before the pandemic. View this interactive data visualization to explore the relative size of the City’s revenue sources and their growth over the past 10 years.
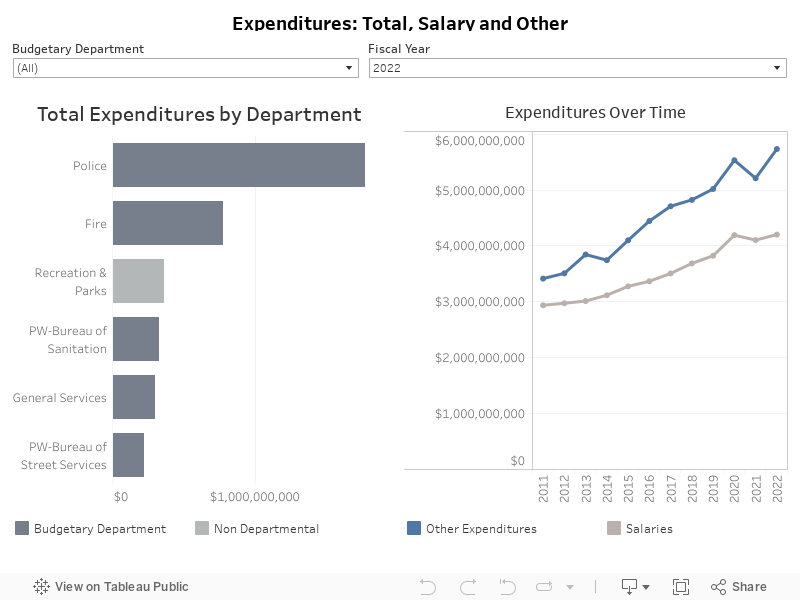
Expenditures
Total budgeted expenditures were $9.4 billion, 5.4% higher than the year prior as spending increased across nearly every category.
This interactive data visualization compares the expenditures of the City’s different departments, as well as non-departmental expenditures, over the past 10 years.
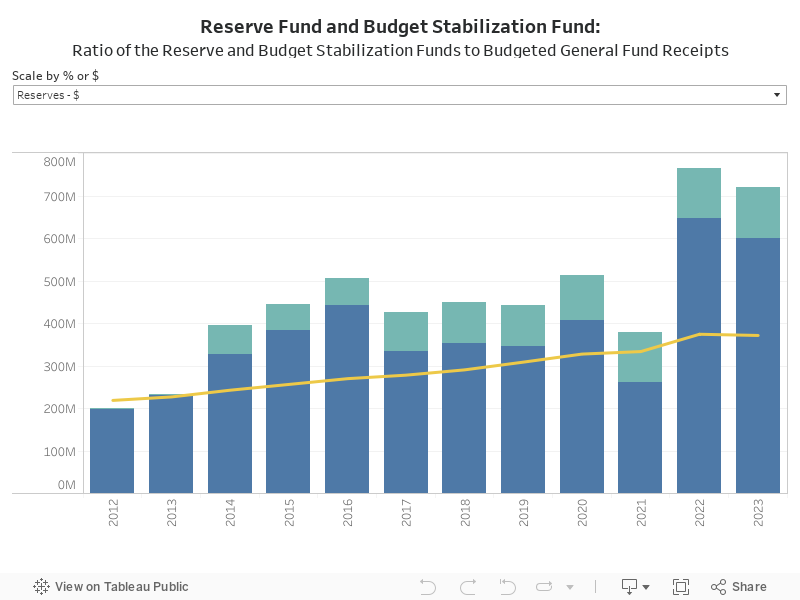
Reserves
The Reserve Fund is established to ensure that funds are available for unanticipated expenditures and revenue shortfalls in the General Fund. The City’s Reserve Fund Policy sets a goal for the Reserve Fund to be at least 5% of the General Fund budget every year. On July 1, 2022, the Reserve Fund had a balance of $601.7 million, 8.1% of the General Fund budget and well above the 5% Reserve Fund Policy goal.
The Budget Stabilization Fund (BSF) was added to the City Charter in 2011. The purpose of the BSF is to set aside funds when the City exceeds revenue projections to help smooth out years when revenue is stagnant or in decline. In fiscal year 2022, the BSF grew slightly to $119.5 million. View the Reserve Fund and Budget Stabilization Fund data in either dollars or percentages by selecting an option in the chart’s dropdown.
Debt
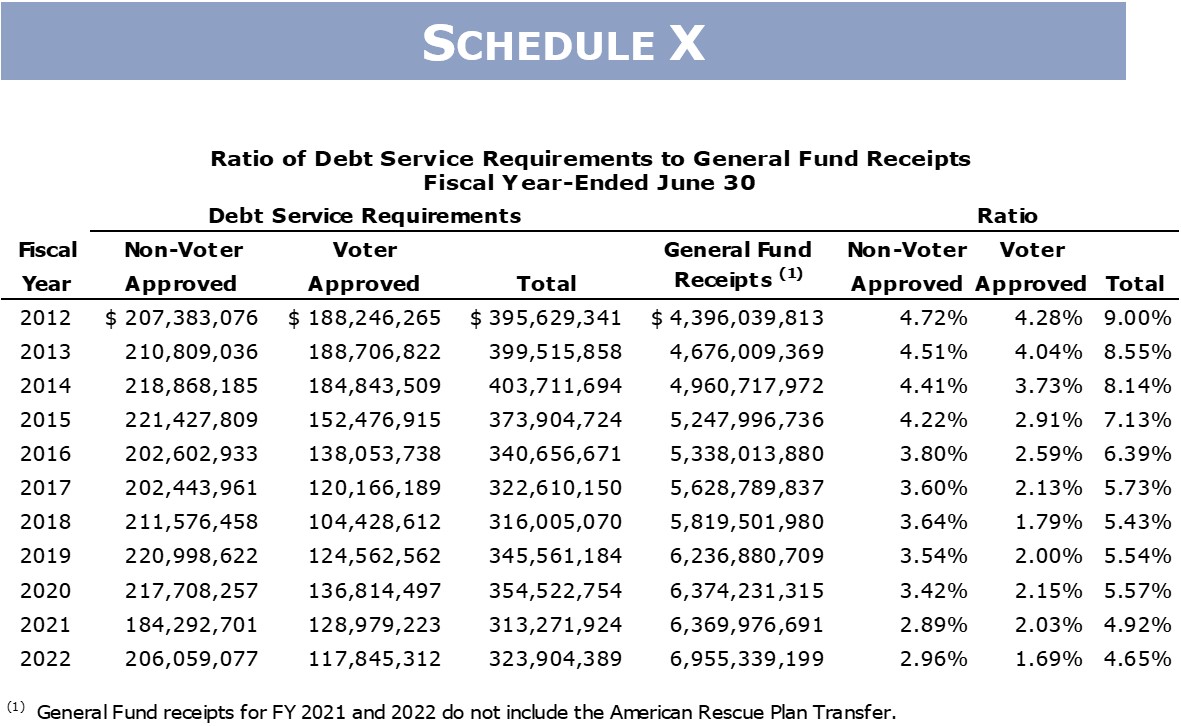
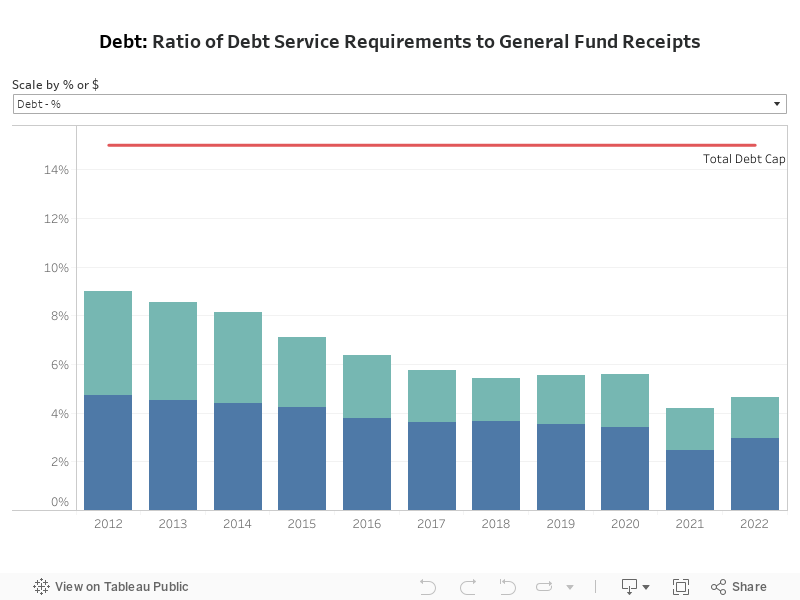
The City’s debt management policy establishes guidelines for the structure and management of the City’s debt obligations. These guidelines include a non-voter-approved debt service cap of 6% and a total debt service cap of 15% as a percent of General Fund revenues. The City’s debt service obligations decreased to 4.65% last fiscal year.
Recommendations
The City’s immediate fiscal situation is solid, but economic conditions remain unstable as cyclical COVID-19 trends, rising inflation, supply chain disruptions and international conflicts continue to impact global markets. The Controller makes the following recommendations in the Preliminary Financial Report:
- Exercise caution when considering new spending requests.
While most revenue streams have recovered to pre-pandemic levels, now is not the time to overspend. Before approving new spending requests, the City must first evaluate its ability to maintain neighborhood services and equity-related programming.
- Preserve a strong rainy day fund.
If recession occurs, local revenues will inevitably be impacted. The City should continue to build its Reserve Fund to be prepared for future emergencies.
- Monitor personnel and retirement spending.
Future salary increases and rising pension costs could prove unsustainable if revenues do not keep pace. The City must continue to monitor these expenditures to ensure they do not constrain its ability to expand services.
October 26, 2022
Honorable Eric Garcetti, Mayor
Honorable Members of the Los Angeles City Council
Re: Preliminary Financial Report for Fiscal Year 2021-22
The Controller’s Office submits the Preliminary Financial Report (PFR) each fall to review the City of Los Angeles’ financials for the prior fiscal year. Our report is the City’s primary look back at municipal finances after the close of the fiscal year, providing an overview and analysis of revenues and expenditures, reserves and bonded indebtedness. In January 2023, the Controller’s Office will follow up by issuing the Annual Comprehensive Financial Report for 2021-2022, which is prepared in accordance with Generally Accepted Accounting Principles and audited by an independent firm of certified public accountants.
Accompanying the PFR are online interactive visualizations with 10 years of data, which may be found at lacontroller.org/pfr2022. Information on special fund balances and uses, Reserve Fund starting balances over the years, and budget appropriations, adjustments, expenditures and revenues, are also on my website.
While the report covers the previous fiscal year, it is meant to help City leaders understand and assess the health of and challenges facing the City’s finances, including the impact of recent inflation and possible economic downturn.
A year of recovery
The previous fiscal year was one of recovery for the City as COVID-19 vaccines became widely available and the economy began to reopen. The City received financial assistance from the American Rescue Plan Act of 2021 (ARPA), accounting for an additional $640 million in revenues available for General Fund expenditures, and subsequently, City revenues rebounded to pre-pandemic levels.
Highlighted in the PFR are these facts about the 2021-22 fiscal year:
- Actual revenues in budgeted funds were $10.2 billion, a 10.4 percent increase over FY 2020-21 and 12.2 percent more than FY 2018-2019 before the pandemic. This figure does not include ARPA assistance.
- Total expenditures (excluding encumbrances) from budgeted funds were $9.4 billion, an increase of 5.4 percent.
- The Fiscal Year-start adjusted Reserve Fund balance was $601.7 million or 8 percent of General Fund receipts anticipated in the 2022-23 Budget, $229.4 million above the 5.0 percent Reserve Fund Policy goal. The beginning Reserve Fund balance for 2022-23 is at its second highest level for the last 10 years.
Concerns remain
While many City revenues have rebounded since the pandemic-related downturn, economic challenges remain and difficult budgeting decisions could arise next year, including:
- Pension costs to the City increased slightly last fiscal year, totaling $1.5 billion and making up 15 percent of total spending. Future increases could be mitigated if the City can hold salary expenditures under long-term averages, but this issue should be monitored carefully.
- While the FY 2022-23 budget dealt with deferred wage increases and upcoming labor negotiations by allocating one-time revenues toward compensation adjustments, the City still faces potential spending increases related to pending litigation and other long-term costs. These costs could constrain the City’s ability to expand services in future years, especially if revenues do not keep pace.
- Numerous economic issues could impact City revenues, including cyclical COVID-19 trends, rising inflation, supply chain disruptions and international conflicts.
To proactively address these concerns, the City should preserve a robust Reserve Fund and Budget Stabilization Fund, and remain cautious when considering future spending requests. By exercising caution now, the City can avoid painful cuts should economic conditions deteriorate.
My staff and I appreciate the cooperation shown by City departments as we prepared this report. Should you have questions or require additional information, please contact my Director of Financial Analysis and Reporting, Wally Oyewole at rahoof.oyewole@lacity.org.
Respectfully submitted,

RON GALPERIN
L.A. Controller
cc: Chris Concepción, Chief Deputy Controller
Sharon Tso, Chief Legislative Analyst
Matt Szabo, City Administrative Officer
At the close of each fiscal year, the Office of the Controller reports on the finances of the City for the year that recently closed. This Preliminary Financial Report is the first part of that reporting process and provides cash basis information on revenues, expenditures, reserves, and bonded indebtedness, including comparisons to the prior year and to the Adopted Budget (Budget).
The second part of this reporting requirement is the Annual Comprehensive Financial Report (ACFR), the City’s official, audited financial statement, which will be released later this fiscal year. Together, these two documents elucidate and inform both City decision-makers and the public on the City’s financial position.
An interactive presentation of the report is available at:
Economic Recovery Continued
Two years ago, the City was confronted with an unprecedented challenge: the global COVID-19 pandemic. In response, the City worked expeditiously and operated in an environment of austerity to maintain core government services, protect small businesses and vulnerable groups, and more. However, in that same year, the City experienced financial challenges as economy sensitive revenues declined and emergency expenditures increased. Fiscal Year 2021-22 was a year of recovery for the City from the COVID-19 pandemic as COVID-19 vaccines became widely available and the economy began to reopen. This same Fiscal Year, the City also experienced a reversal of previous fortunes as the first tranche of financial assistance from the Federal government arrived. This assistance, otherwise known as the American Rescue Plan Act of 2021 (ARPA), accounted for an additional $639.5 million in revenues available for eligible General Fund expenditures, and subsequently, the City experienced revenues rebounding to pre-pandemic levels.
The Fiscal Year 2021-22 Budget was adopted with a framework of economic improvement, and projected a strong rebound, with 7.7 percent growth in General Fund revenue, excluding the first tranche of $639.5 million ARPA funding received in May 2021. With the City experiencing recovery of most revenue sources, combined with the receipt of Federal funds, the City ended Fiscal Year 2021-22 with total General Fund revenues exceeding the Budget by $91.6 million, growing by 8.4 percent above Fiscal Year 2020-21.
While the recovery from pandemic-era low revenue receipts occurred at such a high growth rate (12.4 percent), the revenues from transient occupancy taxes and parking-related receipts have not fully returned to levels seen before the pandemic.
The Fiscal Year 2022-23 Budget assumes the City will continue economic recovery from the pandemic-related downturn and return to a steadier state. The Budget reflects that the City will continue investing in its communities most impacted by the pandemic with enhanced perception and commitment to incorporate equity and diversity into how services are delivered, continue to invest in the mitigation of homelessness, and invest in public safety.
Although, in general, revenues have rebounded, the economy still faces several headwinds such as cyclical COVID-19 trends that still pose health risks, a new 40-year high inflation, supply chain crises, and disruptions caused by the war abroad. The confluence of these issues threaten to slow down recovery trends, and could negatively impact the City’s revenues.
While not yet visible in much of the economic data, particularly in the job market data, worries about a recession continue to mount. It is therefore prudent that the City preserve a robust Reserve Fund to weather any potential future economic crises without enduring a round of destabilizing cuts. The Reserve Fund started Fiscal Year 2021-22 at 8.6 percent with a record-high balance of $647.0 million. The City began the Fiscal Year 2022-23 at 8.1 percent of the General Fund Budget or $602 million. The pathway to maintaining the City’s long-term fiscal health is to abide by the City’s Financial Policies in maintaining the cumulative value of the Reserve Fund, the Budget Stabilization Fund, and the UB line item for mid-year adjustments at an amount equal to at least 10 percent of budgeted General Fund revenues. Based on the Reserve Fund balance as of July 1, 2022, the City began the Fiscal Year 2022-23 with budgetary reserves totaling 11.0 percent of budgeted General Fund revenues.
This Preliminary Financial Report is organized in four distinct sections, as outlined in the following sections:
- Revenues and Expenditures: A discussion of the fiscal year ended 2021-22, including trend analysis, notable changes from prior years, and financial performance relative to the Budget;
- Reserve Fund: A discussion of the current condition of the City’s Reserve Fund, and analysis of the various factors influencing that figure;
- Budget Stabilization Fund: A discussion of the Fund policy and how actual figures compare to the policy; and
- Bonded Indebtedness: A statement of the City’s total bonded indebtedness and debt service requirements; as well as comparisons to City policies and legal limitations.
Revenues and Expenditures
Actual Revenue was 0.7 percent above the Budget, growing by 10.4 percent above Fiscal Year 2020-21 and 11.2 percent over Fiscal Year 2019-20 (excluding transfers from Reserve and ARPA funds). General Fund revenue grew by 7.9 percent compared to last year and was 1.4 percent above the Budget. Almost all General Fund Revenue sources outperformed the budgeted amount. Revenue in budgeted special revenue funds increased by 16.0 percent over the prior year; however, it was 0.5 percent under the Budget due to shortfalls in Building & Safety Building Permits Enterprise Fund’s revenues, State Proposition A revenues, and a delay in Disaster Response Reimbursements. Receipts from the American Rescue Plan Act of 2021 (ARPA) are not included in Budgeted Revenue because the funds were not appropriated for spending in the 2021-22 Budget, and the receipts were transferred to the General Fund as cash.
Both expenditures and encumbrances increased 5.2 and 31.6 percent, respectively, from June 30, 2021 to June 30, 2022. All of the spending categories increased with the exception of Proposition A Local Transit Assistance and Human Resource Benefits.
Reserve Fund
The City’s Reserve Fund Policy (CF 98-0459) sets a Reserve Fund cash balance goal of at least 5.0 percent of budgeted General Fund receipts. However, the Reserve Fund started Fiscal Year 2021-22 at 8.6 percent with a record-high balance of $647.0 million, $384.5 million more than twelve months earlier. The large Reserve Fund balance resulted from a combination of a General Fund surplus transfer of ARPA funds revenue, fourth-quarter revenue growth, and reduced General Fund expenditures. Although slightly lower than Fiscal Year 2021-22 balance, the Reserve Fund began Fiscal Year 2022-23 at a healthy 8.1 percent of the General Fund Budget or $602 million.
Budget Stabilization Fund
The Budget Stabilization Fund (BSF) is the City’s mechanism for accumulating excess tax revenues in growth years to mitigate shortfalls in lean years. The BSF balance on June 30, 2022, was $119.5 million.
Bonded Indebtedness
Bonded indebtedness and the City’s debt service obligations increased due to the issuance of MICLA Revenue Bonds Series 2021-C and General Obligation Bonds Series 2021-A and 2021-B. However, the debt service payments ratio to General Fund receipts decreased from 4.9 percent to 4.7 percent of General Fund revenue, and is well under the City’s 15 percent policy ceiling.
Discussion
The Preliminary Financial Report focuses on the cash basis financial information of the City for 2021-22, providing information on revenues and expenditures, the Reserve Fund, the Budget Stabilization Fund, and bonded indebtedness. An interactive presentation, along with all the exhibits and schedules used in the report, is available at:
https://lacontroller.org/pfr2022
Audited financial statements, prepared in conformity with Generally Accepted Accounting Principles (GAAP), will be presented in the City’s Annual Comprehensive Financial Report (ACFR) later this Fiscal Year.
Actual revenues in budgeted funds for 2021-22 were $10.2 billion, an increase of 10.4 percent compared to 2020-21, and an increase of 12.2 percent over pre-pandemic 2018-19. The revenues do not include the ARPA funding and transfer from the Reserve fund.
Total expenditures (excluding encumbrances) from budgeted funds increased by 5.2 percent to $9.3 billion compared to 2020-21. In addition to the expenditures, $679.6 million were encumbered as of June 30, 2022.
Exhibit 1 shows the ten-year history of total revenues and expenditures.

Since 2012-13, revenues have grown by 49.9 percent (average annual growth of 4.7 percent), while expenditures have increased by 46.2 percent (average annual growth of 4.3 percent). As seen in Exhibit 1, revenues have consistently exceeded expenditures, which has allowed the City to grow the Reserve and Budget Stabilization Funds.
The 2021-22 Budgeted revenue totaled $10.8 billion (excluding $640.1 million in available balances), of which $7.5 billion was in the General Fund, and $3.3 billion was in Special Revenue Funds. Total receipts, including transfers from Reserve and ARPA funds, for the year were $10.9 billion, 0.7 percent more than budgeted, while total expenditures (including encumbrances) were $9.9 billion, 13.4 percent less than budgeted. Detail of budgeted and actual receipts and expenditures is presented in Schedules III and IV.
General Fund Revenues
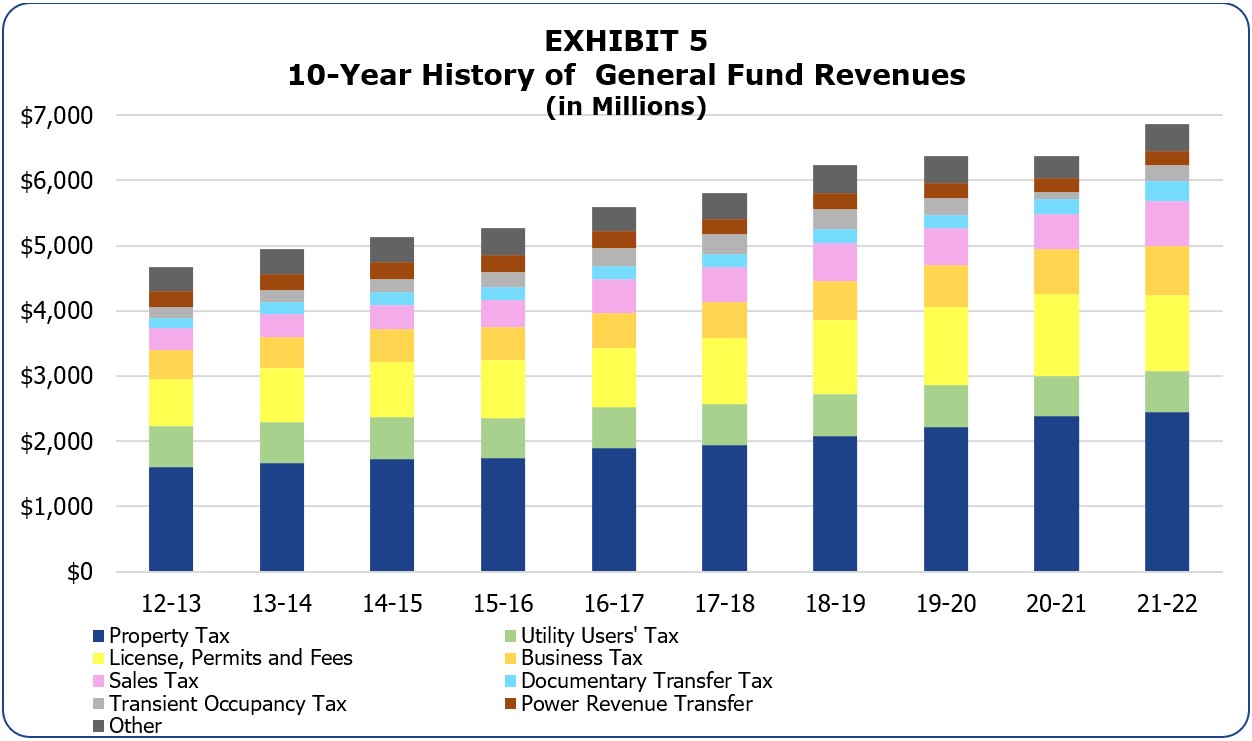
The General Fund is the primary operating fund of the City. It is used to account for all financial resources except those legally required to be accounted for in other funds. General Fund revenues are derived from such sources as taxes, licenses, permits, fees, fines, intergovernmental revenues, charges for services, special assessments, and interest income. Exhibit 2 presents 2021-22 actual General Fund revenues by percentage.
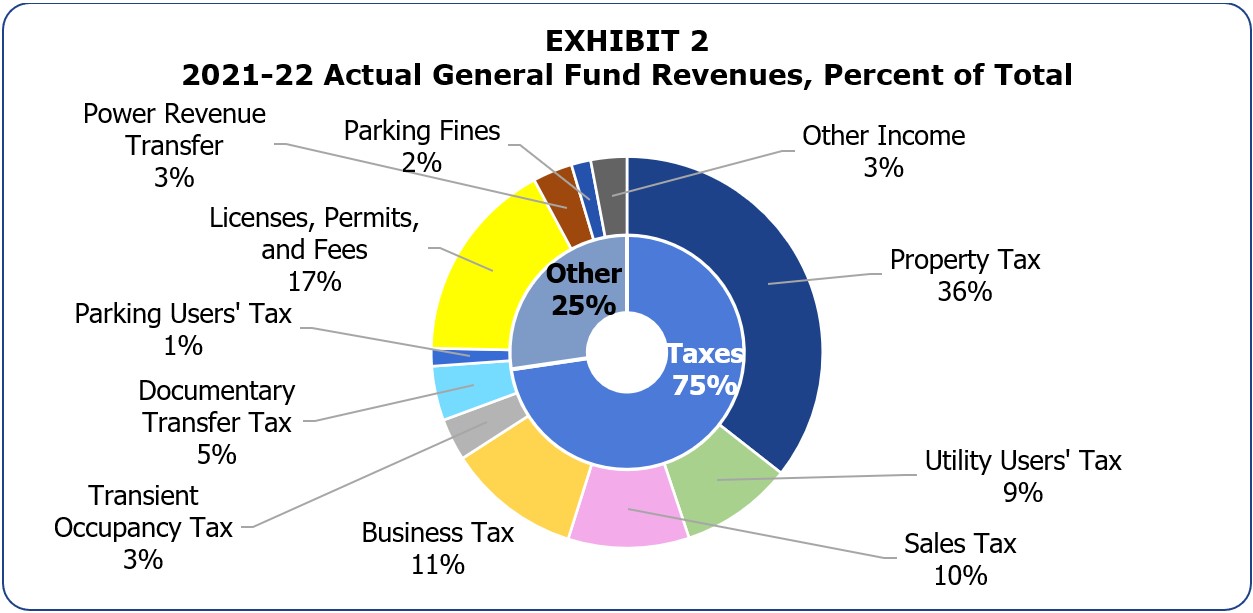
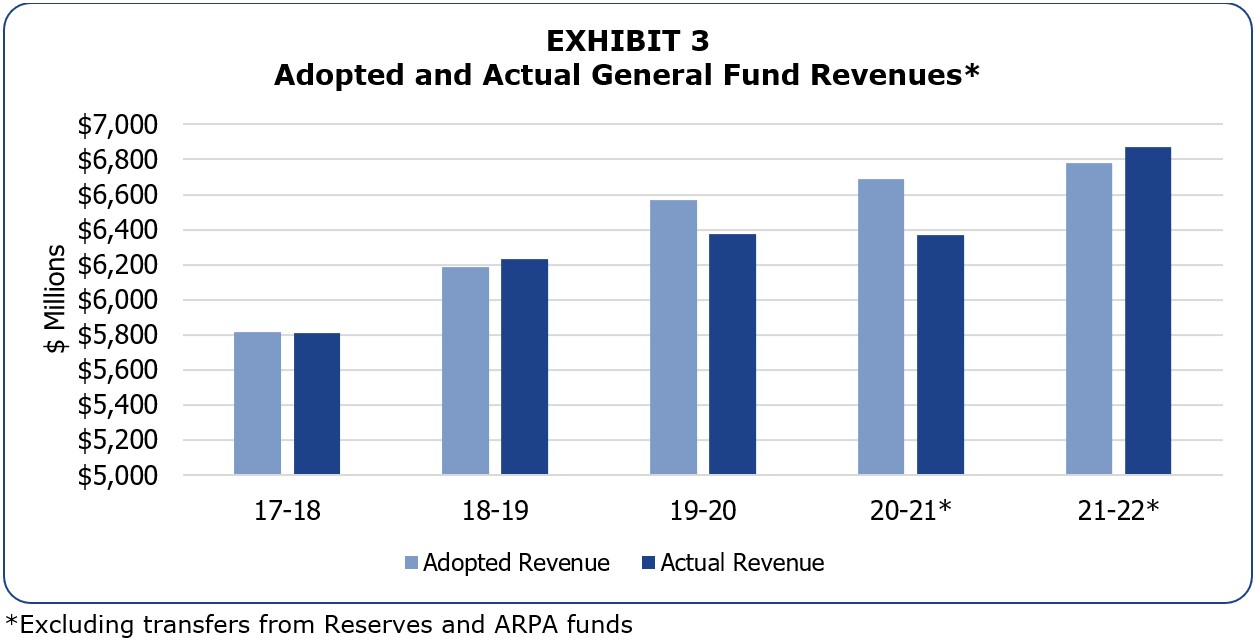
Fiscal Year 2021-22 General Fund receipts totaled $6.9 billion (excluding the transfers from Reserve and ARPA funds), $91.5 million or 1.4 percent above the Budget, $500.2 million or 7.9 percent higher than 2020-21, and $639.1 million or 10.3 percent higher than the pre-pandemic 2018-19. Over the past five years, General Fund revenue averaged 4.2 percent growth, and is now back on track after negative growth in Fiscal Year 2020-21. Exhibit 3 compares adopted and actual General Fund receipts by fiscal year.
All General Fund revenue sources outperformed the Budget in 2021-22 except for the following: Property Taxes ($76.8 million or 3.2 percent below Budget), Licenses, Permits, Fees and Fines ($90.5 million or 7.3 percent), Power Revenue Transfer ($0.8 million or 0.4 percent), Parking Fines ($13.3 million or 10.8 percent), and Grant Receipts ($50.8 million or 55.6 percent).
Property Tax receipts were $62.1 million (2.8 percent), higher than 2020-21 receipts but lower than the budget by $76.8 million or 3.2 percent. Ex-CRA Property Tax Increment revenue was $8.5 million over the budget and $7.6 million lower than the prior year.
Utility Users’ Tax was 5.5 percent above the Budget, 3.7 percent higher than last year’s actual receipts; however, it was 0.9 percent lower than pre-pandemic Fiscal Year 2018-19. While all components were above the Budget, Telephone Users Taxes experienced negative growth year over year. It was lower than last year’s receipts by $2.1 million or 1.8 percent, and lower than pre-pandemic Fiscal Year 2018-19 by $38.4 million or 25.7 percent.
The Budget assumed 4.4 percent growth for Business Tax receipts; however, actual receipts were 9.4 percent or $65.2 million higher than last year and 5.7 percent or $41.0 million over the Budget. Non-cannabis Business Tax actual receipts of $632.1 million were 14.7 percent or $81.2 million more than the Budget and 13.8 percent or $76.5 million more than last year. Meanwhile, the Recreational Cannabis Business Tax generated $125.5 million in revenues, which was lower than the Budget by $40.2 million (24.3 percent), and lower than last year’s actual by $11.3 million (8.3 percent).
Sales Tax Receipts were $80.7 million or 13.3 percent above the Budget, $162.7 million or 31.0 percent more than last year, and $105.9 million or 18.2 percent more than 2018-19 receipts.
Franchise Income ended higher than the Budget by $11.3 million, mainly due to Natural Gas Franchise income that exceeded the Budget by $6.1 million and Commercial and Multi-family Solid Waste Franchise Income which was above Budget by $4.9 million.
Licenses, Permits, Fees and Fines ended at $90.5 million or 7.3 percent lower than the Budget, $103.3 million or 8.2 percent lower than last year’s receipts. However, if the $125.0 million in one-time COVID-19 Federal Relief fund received in prior year were excluded, 2021-22 receipts were actually higher by $21.7 million or 1.9 percent. Departmental receipts (relating mainly to licenses, permits, and various service fees collected by departments) and Emergency and Ambulance Services were above the budgeted amounts of $37.4 million and $22.0 million, respectively. However, other components such as Services to the Los Angeles County Metropolitan Transportation Authority (LACMTA) and Services to Proprietary Departments were under budget by $30.8 million and 17.1 million, respectively. The shortfall in reimbursements from special revenue funds was $102.2 million.
Grants receipts were under Budget by $50.8 million, mainly due to delayed reimbursements from the Federal Emergency Management Agency (FEMA) Public Assistance program for pandemic-related costs.
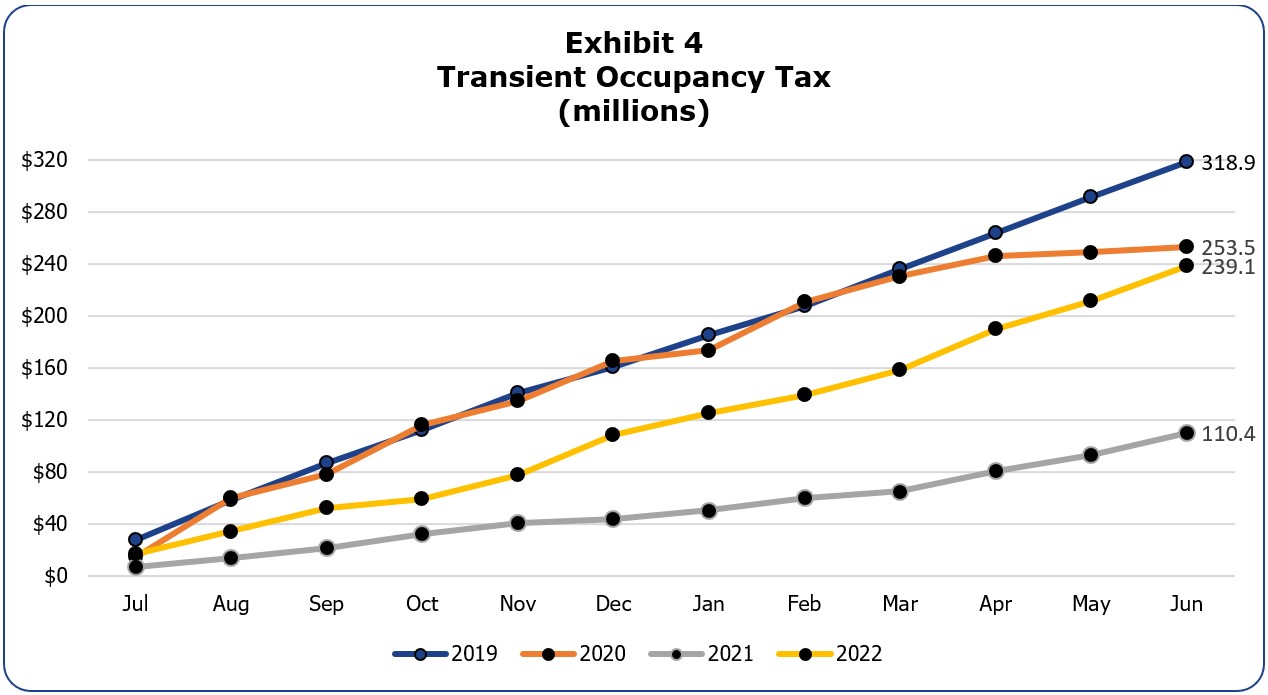
Transient Occupancy Tax (TOT, commonly known as Hotel Tax) receipts dropped 65.4 percent by the end of Fiscal Year 2020-21 compared to pre-pandemic 2018-19 since travel and hospitality virtually stopped. However, with the reopening, the City experienced notable increases in TOT revenues. Actual receipts were $55.8 million or 30.5 percent above the Budget and $128.7 million or 116.6 percent higher than last year. While receipts have improved significantly, they are still 25.0 percent below pre-COVID levels. Employee costs and worker shortages appears to be holding back rebound in hospitality and travel. International tourism and business travel still have a long recovery ahead.
Exhibit 4 shows cumulative Transient Occupancy Tax monthly receipts for FY 2019, FY 2020, FY 2021, and FY2022.
Documentary Transfer Tax grew to all-time highs during the pandemic. The actual receipts were $81.8 million or 36.0 percent above the Budget and $72.9 million or 30.9 percent above last year. The tight housing supply has driven strong price growth and increased sales volumes since the beginning of the pandemic. However, Documentary Transfer Tax receipts could take a hit in the later part of the current year or next year due to the ongoing high inflation and high interest rates threatening to slow down housing price growth and sales volume.
The Power Revenue Transfer was $0.8 million (0.4 percent) less than the Budget and $6.7 million or 3.1 percent more than last year, which was the lowest in a decade. It has declined since 2016, with a 3.1 percent average decrease over the previous five years.
Exhibit 5 displays a 10-year history of General Fund receipts, excluding transfers from the Reserve Fund.
Appropriations, Expenditures & Encumbrances
Total expenditures, including encumbrances, were $9.9 billion. This amount was $621.9 million or 6.7 percent higher than 2020-21 and $1.5 billion or 13.4 percent lower than the Budget.
Exhibit 6 compares the Budget, the final appropriation (which includes interim appropriations made during the year), and actual expenditures and encumbrances by fiscal year.
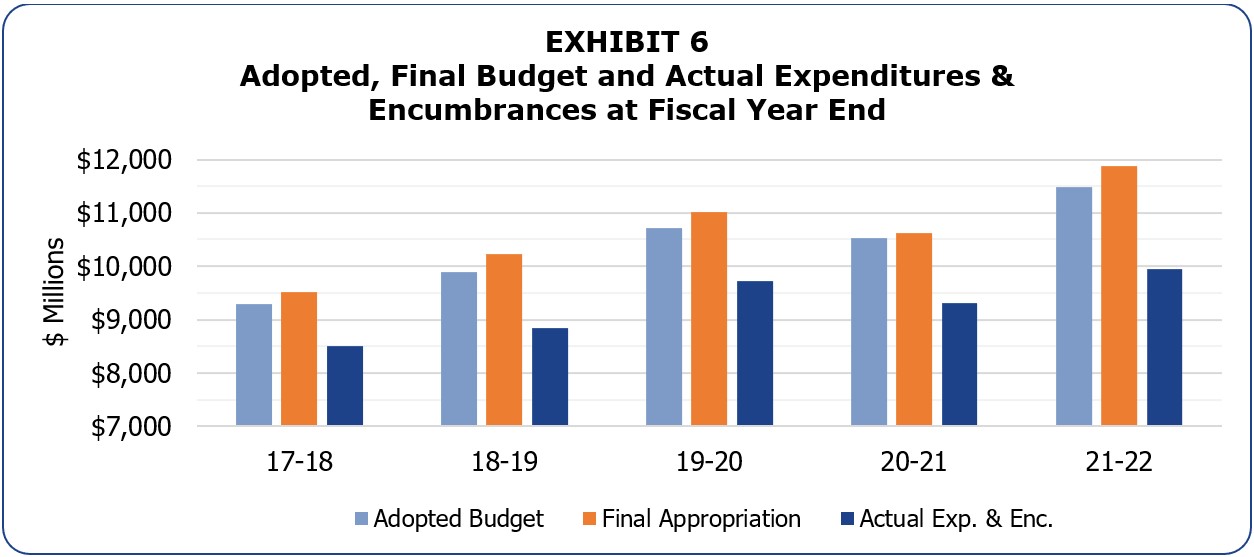
For the last five years, total actual Expenditures and Encumbrances have grown by an average of 4.0 percent. For the same period, Salaries (excluding Library and Recreation and Parks) increased by 3.8 percent, and Services, Supplies, Equipment, and Others by 6.9 percent. Salaries are made up of Sworn and Civilian Salaries, which increased by 3.8 percent and 3.4 percent, respectively.
Exhibit 7 breaks out summarized categories of budgetary and actual expenditures and encumbrances for 2020-21 and 2021-22. Detailed information by department may be found in Schedule IV.
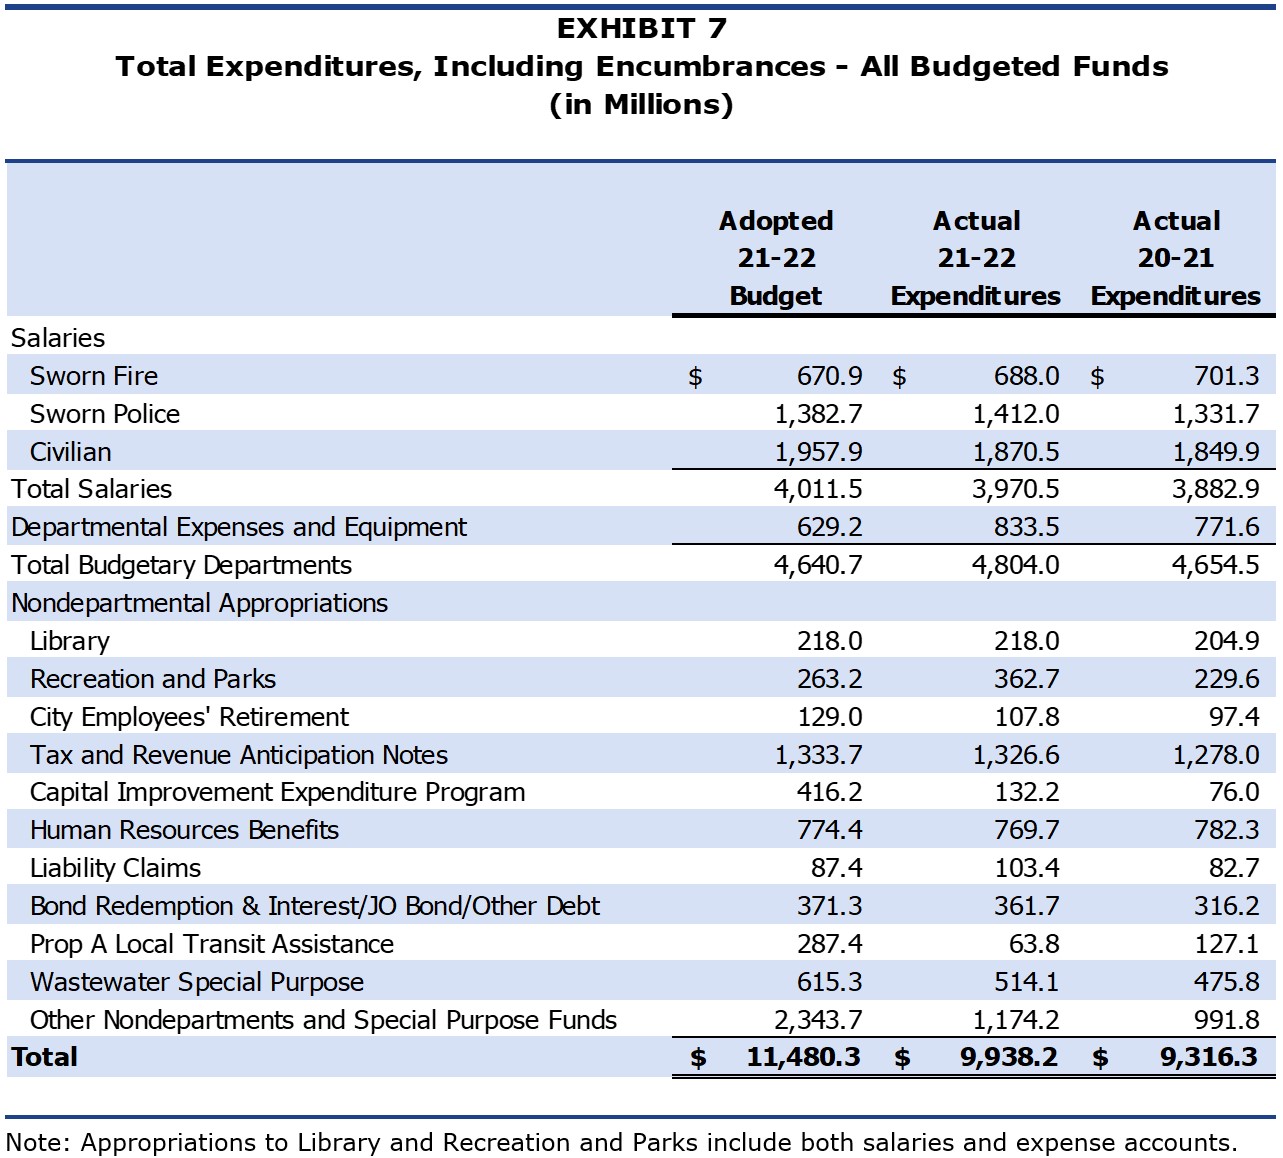
Salaries increased by $87.6 million or 2.3 percent compared to last year, mainly due to payments of deferred excess sick payouts and one-time bonuses to certain labor organization members for a portion of deferred compensation adjustments.
Total contributions to Library and Recreation and Parks increased by $13.1 million and $133.1 million, respectively. Besides regular transfers to Library and Recreation and Parks made pursuant to Charter requirements that are tied to growth in the City’s total assessed valuation, additional transfers of $95.0 million to Recreation and Parks were made from ARPA funding for projects in connection with deferred maintenance and childcare facilities.
Capital Improvement Expenditure Program (CIEP) expenditures were 68.2 percent or $284.0 million lower than the Budget, and $56.2 million more than the prior year. The most significant variance was in Clean Water Projects, which was $210.4 million lower compared to Budget, but was $32.0 million more than the preceding year’s actual.
Human Resources Benefits expenses were $4.7 million or 0.6 percent below the Budget, and lower by $12.6 million or 1.6 percent compared to last year. The decrease was primarily due to decreased health care subsidies for employees, by $16.1 million or 3.0 percent, and Unemployment Insurance costs, which fell by $3.9 million.
Exhibit 8 breaks out expenditures and encumbrances by Governmental Activity.
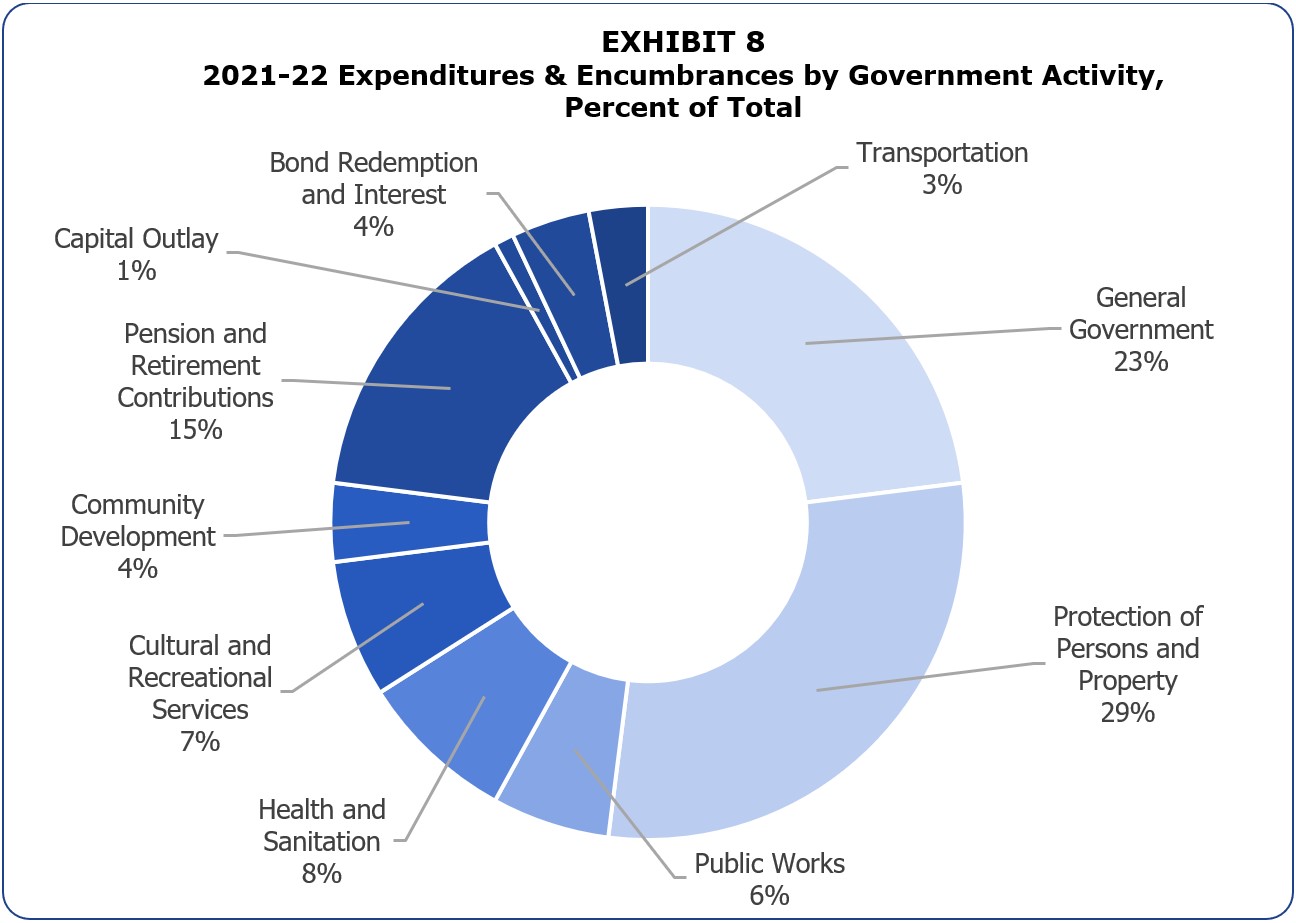
As budget priorities shifted and the economy expanded, the share of spending for the Protection of Persons and Property has remained remarkably stable at almost a third of the total expenditures.
Additionally, the contributions to the City’s pension systems totaled $1.5 billion, 15.0 percent of total spending. This amount is up slightly from the prior year. Future increases could be mitigated to the extent that the City can hold salary expenditures under long-term averages, but this issue should be monitored carefully.
The City ended the Fiscal Year with a total of $679.6 million in encumbrances: $503.6 million in the General Fund and $176.0 million in special revenue funds, $130.8 million was encumbered for salaries to be paid in July 2022, with the balance encumbered in expense, equipment, and special revenue fund project accounts.
Encumbered funds for salaries are earmarked for the fiscal year’s last pay period, and unspent funds are immediately released after payroll is made. Funds encumbered for expense accounts are continued across fiscal years to ensure that cash is available to cover the expenditure when it is made. Schedule V provides a listing of General Fund encumbrances by the department.
The General Fund Encumbrance Policy provides that encumbered funds that remain unspent for a period longer than one Fiscal Year shall be disencumbered every fiscal year, with the exception of capital project funds. Prior-year encumbrances are automatically disencumbered unless exempted by Mayor and Council approval. As part of the 2021-22 Year-End Financial Status Report, a total of $55.9 million was exempted from this policy, an increase of $2.9 million from last year’s exemptions. As noted in past years, exceptions should be closely monitored.
Unencumbered General funds revert to the Reserve Fund at year-end. As such, exemptions to the automatic disencumbrance policy reduce reversions, thereby reducing the cash available in the Reserve Fund to pay for emergencies and contingencies. Section II discusses the status of the Reserve Fund in more detail.
The Reserve Fund is established to ensure that funds are available for unanticipated expenditures and revenue shortfalls in the General Fund. The Reserve Fund consists of an Emergency Account and a Contingency Account.
The Emergency Reserve Account is fixed at 2.75 percent of the adopted General Fund receipts. A finding of urgent economic necessity is required to use these funds. The Contingency Reserve Account includes all monies in the Reserve Fund over and above the amount required to be allocated to the Emergency Account. Contingency Reserve Account funds can be a source of additional funding to cover unanticipated expenses or revenue shortfalls.
The City’s Reserve Fund Policy (CF 98-0459) sets a Reserve Fund cash balance goal of at least 5.0 percent of budgeted General Fund receipts. Exhibit 9 displays the past ten years of beginning Emergency and Contingency Reserve Fund balances compared to this policy target.

The Reserve Fund is a major indicator of the City’s fiscal health. It is vital to cash flow, bond ratings, and the ability to manage financial challenges as the City did in 2019-20 when almost $200.0 million from the Reserve Fund was used to balance the General Fund revenue shortfall.
Failure to maintain the City’s Reserve Fund at an appropriate level not only exposes the City to significant risk in the event of an emergency but could also have negative financial impacts due to the increased cost of borrowing.
Reserve Fund Status
After the 2021-22 accounting close, budgetary appropriations, return of advances, and reappropriations, the Fiscal Year-start adjusted Reserve Fund balance was $601.7 million or 8.08 percent of General Fund receipts anticipated in the 2022-23 Budget, $229.4 million above the 5.0 percent Reserve Fund Policy goal.
Exhibit 10 shows Adopted and Actual Beginning Reserve Fund Balances for the last ten years.

The Beginning Reserve Fund balance for 2022-23 is at its second highest level for the last ten years, after reaching the lowest in 2020-21, and is $124.2 million more than the assumed in the Fiscal Year 2022-23 Adopted Budget.
Adjustments to the Reserve Fund Cash Balance
At the end of each Fiscal Year and the beginning of the next, a number of transactions are required to accurately reflect the status of the Reserve Fund through the closing of the City’s books. Exhibit 11 details the year-end and year-start adjustments to the Reserve Fund Cash Balance, comparing the Budget versus the actual.

The following are descriptions of the line item changes to the Reserve Fund listed in Exhibit 11:
Reserve Fund Cash Balance (June 30, 2022)
As of June 30, 2022, after closing the City’s General Ledger, the recorded Reserve Fund balance was $1.0 billion. This amount was $176.8 million more than anticipated in the 2022-23 Budget. The Reserve Fund cash balance is adjusted by the following factors to arrive at the year-end balance:
- Balance Before Year-End Reversions/Borrowings
The amount of cash available in the Contingency Reserve prior to adjustments for year-end reversions, unallocated revenues, and borrowings. It does not include cash in the Emergency Reserve. For 2021-22, this amount was higher than the anticipated in the Budget due to a higher than anticipated return of advances and early reversion made after the Budget was adopted.
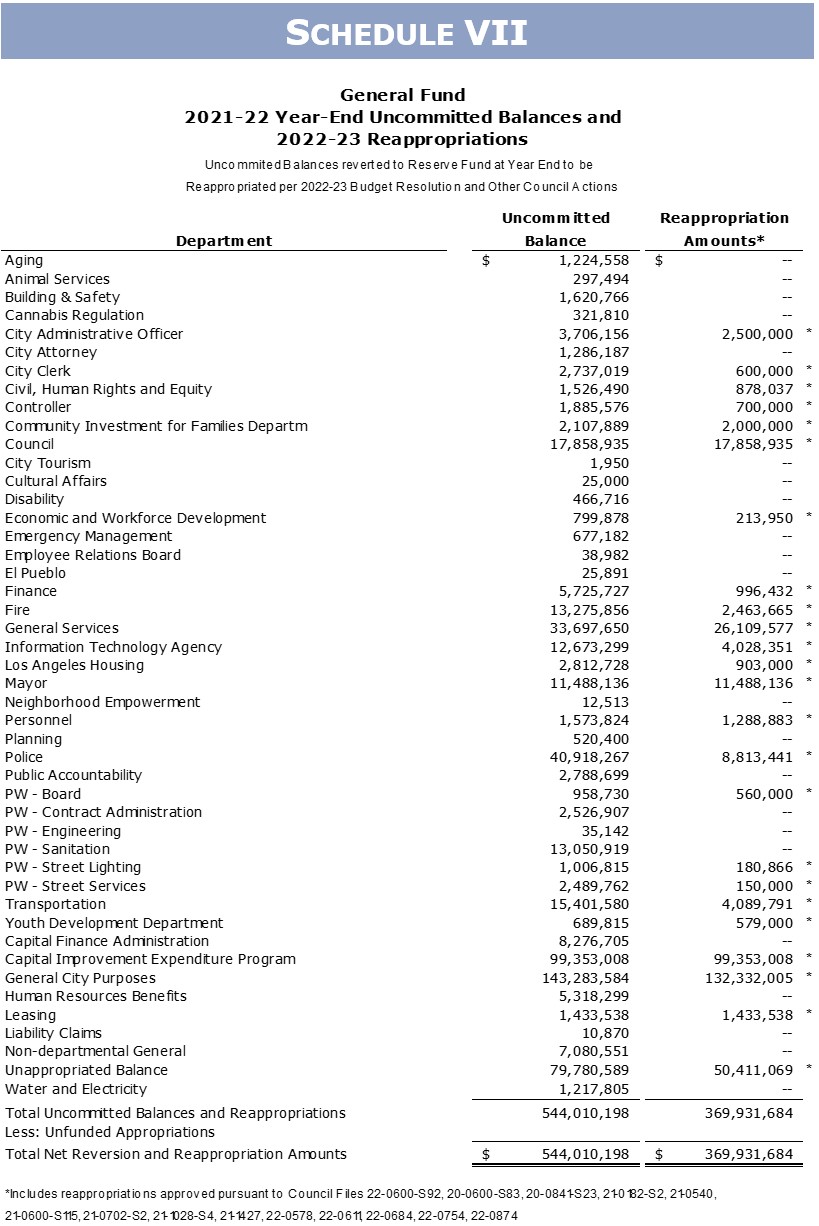
- Reversion of Uncommitted Balances
Uncommitted General Fund appropriations are reverted to the Reserve Fund at fiscal year-end. Appropriations (spending authority) granted to City departments by the Mayor and Council are committed throughout the year in the form of encumbrances and expenditures. Remaining or uncommitted balances are reverted to the Reserve Fund to the extent that there is available cash in the General Fund.
In 2021-22, the Budget estimated $380.7 million in reversions. The uncommitted balance at year-end was $667.3 million. Excluding unfunded appropriations, a total of $544.0 million reverted to the Reserve Fund. For a detailed breakdown of uncommitted balances by department, please see Schedule VII.
- Year-end Unallocated Revenue
Unallocated revenue occurs when revenues exceed the total budget appropriation. At Fiscal Year-end, excess receipts of $65.1 million reverted to the Reserve Fund as unallocated revenue. The 2022-23 Adopted Budget anticipated $106.5 million in unallocated revenue. Actual receipts were $41.4 million less than the budgeted unallocated revenue.
- Advances Under CF 21-0600-S113
Council File 21-0600-S113 authorized the Controller to borrow from the Reserve Fund at year-end to balance departmental budgets where needed in order to facilitate the closing of the City’s General Ledger. The Controller is authorized to increase appropriations within established limits without getting itemized Mayor and Council approval, a process that would delay the closing of the City’s General Ledger. Advances were made to the department of General City Purposes, $7,459.
- Advances Under Charter Section 261(i) for Unfunded Encumbrances and Expenditures
Under Charter Section 261(i), the Controller transfers funds from the Reserve Fund as a loan to any fund that becomes depleted due to tardy receipt of revenue. The 2022-23 Budget estimated $50.0 million in year-end advances. Actual advances were $55.1 million, consisting of $40.0 million in unfunded expenditures and $15.1 million in unfunded encumbrances. See Schedule VIII for a breakdown by department.
Unfunded expenditures generally occur when transactions take place prior to receipt of funding (e.g., grants on a reimbursement basis) and/or due to billing delays. When the funding source reimburses the costs, departments are able to repay the advances. If funding is not available, departments may request Mayor and Council approval to write off the advances. Unfunded encumbered amounts represent a technical adjustment at year-end and are reversed at the start of the new Fiscal Year, as documented in the following section.
Reserve Fund Cash Balance (2022-23 Year-Start)
The year-end Reserve Fund cash balance is not the same as the year-start cash balance for the next year. The following technical adjustments are made after the close of the prior Fiscal Year but are accounted for in determining the year-start cash balance:
- Return of Advances for Unfunded Encumbrances
Advances for unfunded encumbrances are reversed at the start of the following fiscal year, as discussed above.
- Transfer to Budget
The 2022-23 Budget includes a $16,648,364 transfer from Reserve Fund to Budget, which is made by the Controller during the Fiscal Year depending on the cash condition.
- Transfer to Budget Stabilization Fund
The 2022-23 Adopted Budget transferred $72.8 million into the Budget Stabilization Fund.
- Reappropriations
The 2022-23 Budget and other Council actions (C.F. 22-0600-S92, 20-0600-S83, 20-0841-S23, 21-0182-S2, 21-0540, 21-0600-S115, 21-0702-S2, 21-1028-S4, 21-1427, 22-0578, 22-0611, 22-0684, 22-0754, and 22-0875) provided that certain uncommitted balances earmarked for specific programs would be reappropriated in the subsequent year if not expended by the year-end. See Schedule VII for reappropriations by the department. Actual reappropriations of $369.9 million were $47.7 million above the estimated $322.2 million Budge
The Budget Stabilization Fund (BSF) was added to the City’s Charter in 2011. The purpose of this fund is to set aside revenues during periods of robust economic growth or when revenue projections are exceeded to help smooth out years when revenue is stagnant or is in decline. The BSF does not have a minimum balance that must be maintained.
The June 30, 2022 BSF cash balance was $119.5 million. Exhibit 12 displays the adopted and prior year cash balance and adjustments of the BSF. The Budget includes a deposit into the Fund in FY 2022-23.
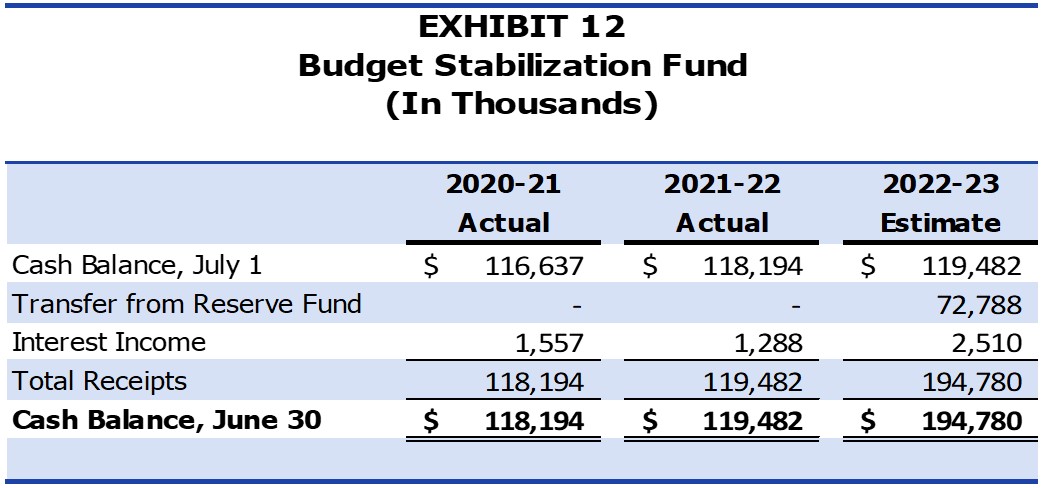
The current BSF Policy (approved January 21, 2020) states that a budget appropriation shall be included as part of the Budget for the following fiscal year when the anticipated growth in combined receipts from seven City “economically sensitive” revenue categories (Property Tax, Utility Users Tax, Business Tax, Sales Tax, Documentary Transfer Tax, Transient Occupancy Tax, and Parking Users Tax) exceeds the growth threshold. For each five-tenths of one percent that the anticipated growth exceeds the growth threshold, the amount of the required appropriation to the BSF shall equal to five percent of the value of the anticipated excess growth. The maximum appropriation shall be equivalent to 25 percent of the value of the growth above the growth threshold. The City Council and Mayor approved the 2021-22 Average Annual Ongoing Growth Threshold of 3.6 percent on March 2022, calculated pursuant to the policy (CF 21-0600-S112). The anticipated excess growth calculated per policy to be transferred to BSF is $72.8 million.
The required deposit to the BSF may be entirely forgone if the City Council and Mayor declare a fiscal emergency or suspend the BSF funding policy based on findings that it is in the City’s best interest to suspend the policy. Mid-year deposits to the BSF or deposits above the required amount may be authorized by the City Council, subject to the approval of the Mayor, at any time during the year from various General Fund sources. Consideration should be given to depositing unanticipated and unbudgeted receipts that are not otherwise required to balance the current year budget.
The City’s Debt Management Policy creates guidelines for the structure and management of the City’s debt obligations. These guidelines include target and ceiling levels for certain debt ratios to be used for planning purposes. The two most significant ratios are a non-voter-approved debt service cap as a percent of General Fund revenues of 6 percent and a total debt service cap as a percent of General Fund revenues of 15 percent.
Exhibit 13 illustrates the City’s compliance with these debt management policies for the past five years.

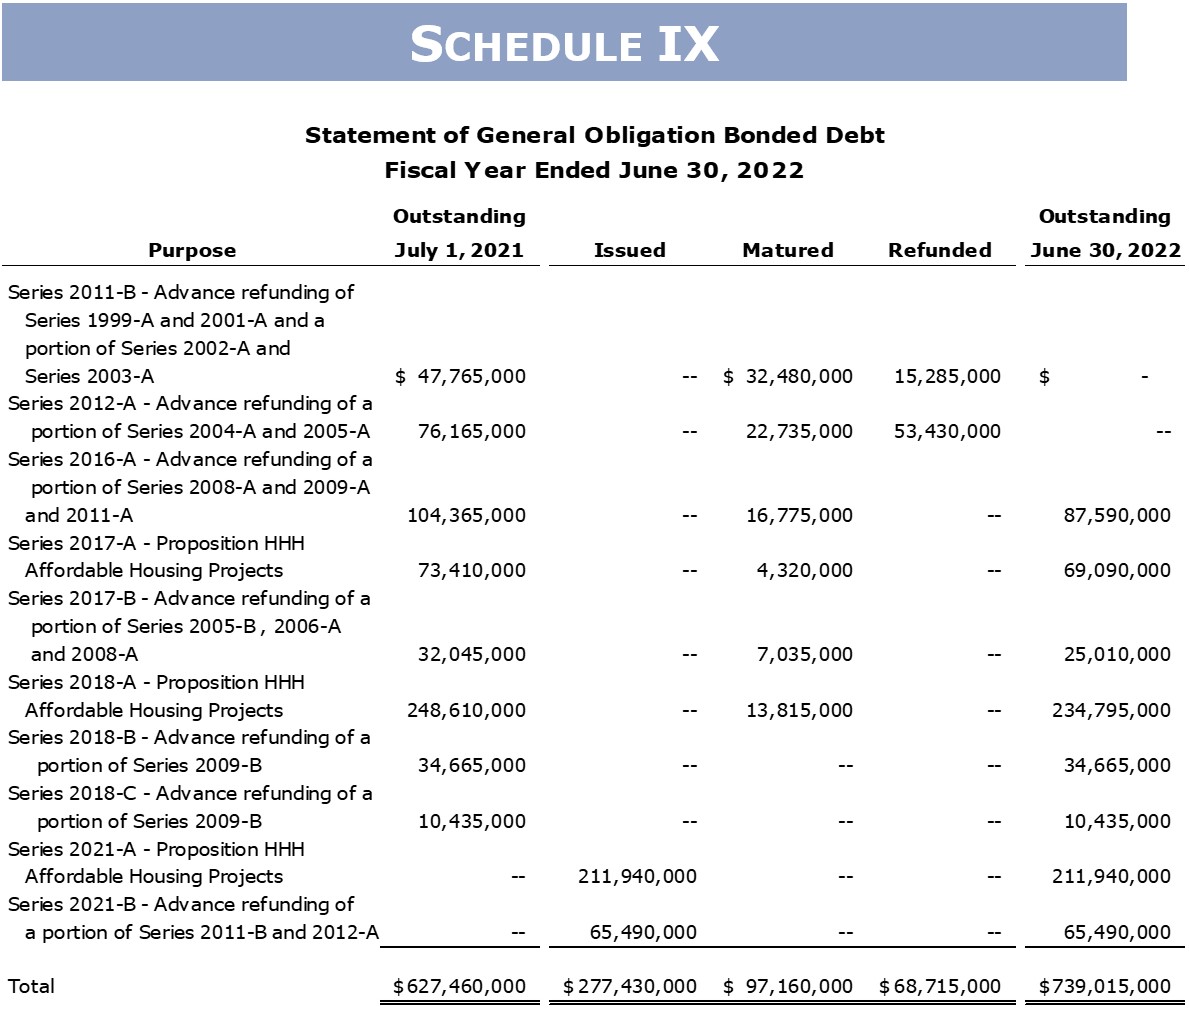
The actual ratio of Debt Service to General Fund Receipts (excluding the ARPA transfer of $639.5 million) was 4.65 percent in 2021-22, comprised of 2.96 percent for non-voter approved debt and 1.69 percent for voter-approved debt. Even though the debt service requirements increased by 3.4 percent, the debt ratio decreased because the General Fund receipts increased at higher rate of 9.2 percent. Schedule IX shows the details of Outstanding General Obligation Bonded Debt.
Exhibit 13 above shows the responsibility the City has exhibited when it comes to debt management. Good administration of debt service obligations has put the City in a position to consider major projects and make strategic financing agreements available when these present financial advantages.
This significant debt capacity also indicates an opportunity to invest in large-scale, long-term infrastructure projects, including facility repair and replacement and new projects designed to stimulate economic development. Such an investment would also provide an opportunity to focus on regional equity, focusing investment in areas of the City which have often been left behind in prior initiatives.
- Schedule I: Cash Condition Statement of Receipts and Disbursements
- Schedule II: Reserve Fund Statement of Receipts and Disbursements
- Schedule III: Statement of Receipts – Budget and Actual (Cash-Basis) – All Annually Budgeted Funds
- Schedule IV: Statement of Budget Appropriations, Expenditures and Encumbrances Budget and Actual (Cash-Basis) – All Annually Budgeted Funds
- Schedule V: Year-End Encumbrances – General Fund
Schedule I: Cash Condition Statement of Receipts and Disbursements

Schedule II: Reserve Fund Statement of Receipts and Disbursements

Schedule III: Statement of Receipts – Budget and Actual (Cash Basis) – All Annually budgeted Funds


Schedule IV: Statement of Budget Appropriations, Expenditures and Encumbrances Budget and Actual (Cash-Basis) – All Annually Budgeted Funds


Schedule V: Year-end Encumbrances – General Fund

- Schedule VI: General Fund Unencumbered Balances Reverted to the Reserve Fund
- Schedule VII: General Fund Year-End Uncommitted Balances and Adopted Budget Reappropriations
- Schedule VIII: Year-End Advances from the Reserve Fund for Unfunded Expenditures and Encumbrances
- Schedule IX: Statement of General Obligation Bonded Debt
- Schedule X: Ratio of Debt Service Requirement to General Fund Receipts Last Ten Fiscal Years
Schedule VI: General Fund Unencumbered Balances Reverted to the Reserve Fund

Schedule VII: General Fund Year-End Uncommitted Balances and Adopted Budget Reappropriations
Schedule VIII: Year-End Advances from the Reserve Fund for Unfunded Expenditures and Encumbrances

Schedule IX: Statement of General Obligation Bonded Debt
Schedule X: Ratio of Debt Service Requirement to General Fund Receipts Last Ten Fiscal Years